


For group trips, a full charter coach is typically one of the lowest-carbon motorized options per passenger, well below a car carrying one or two people and often below a short flight. But that advantage isn’t automatic. It hinges on occupancy, route type, and fuel choice. The rest of this guide shows you how to calculate a specific trip’s footprint and what actually shrinks it.
TL;DR:
- Using full occupancy on highway routes with renewable fuels or hybrid engines significantly reduces per-passenger emissions, especially compared to urban buses.
- Estimating trip emissions based on distance and passenger count is quick and reliable enough for most planning needs, with actual fuel data providing even more accuracy.
- Maximizing vehicle occupancy and reducing deadhead miles during route planning are the most effective ways to lower emissions, outweighing vehicle type or fuel source alone.
- Tracking actual passenger counts, mileage, and fuel consumption enables organizations to include coach trips accurately in their Scope 3 emissions inventories.
- Choosing the proper vehicle size for your group, minimizing idling, and requesting operational data from operators lead to the biggest carbon savings in group transport.
Table of Contents
- Why Charter Buses Usually Beat Cars on Carbon Per Passenger
- How to Calculate the Carbon Footprint of a Specific Charter Trip
- Cutting Charter Bus Emissions: What Planners Can Actually Control
- Reporting Coach Travel in Corporate ESG and Scope 3 Inventories
- Reliant Transportation’s Take on Lowering Trip Footprints
- Book a Lower-Carbon Group Trip With Reliant Transportation
- Sources
Why Charter Buses Usually Beat Cars on Carbon Per Passenger
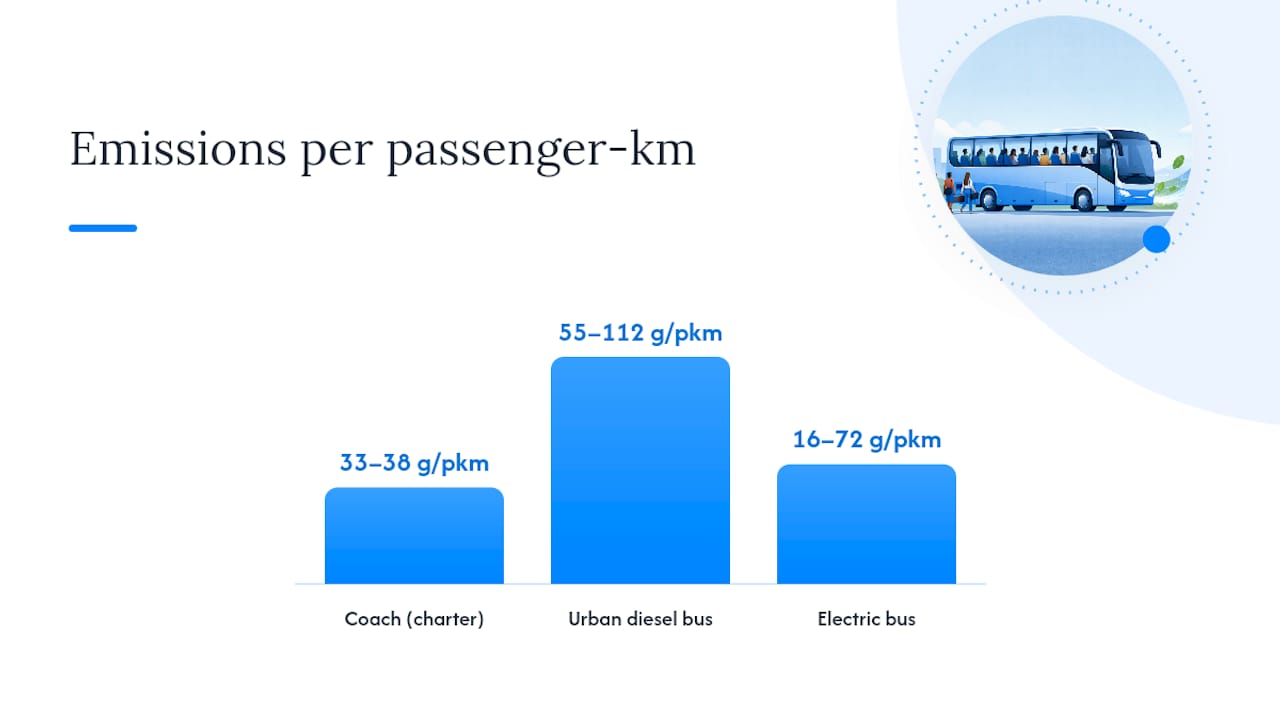
Charter buses win on emissions math because they spread one engine’s output across dozens of people instead of one or two. A peer-reviewed review of transport emission factors puts long-distance coaches at roughly 33 to 38 grams of CO2 per passenger-kilometer, while urban diesel buses average closer to 87 g/pkm, ranging from 55 to 112 depending on route and load. That gap between coach and city bus tells you something important: it’s not the vehicle type alone driving the number, it’s how the vehicle gets used.
Coaches running highway routes at steady speeds burn less fuel per mile than buses stuck in stop-and-go city traffic making frequent stops. Add a higher average load factor, since charter groups tend to fill more seats than a public transit route at 2 p.m. on a Tuesday, and the per-passenger number drops fast.
A few things swing that range:
- Vehicle age and maintenance — older diesel engines and poorly tuned drivetrains burn more fuel per mile.
- Fuel type — renewable diesel (HVO) and hybrid drivetrains cut emissions versus standard diesel.
- Grid intensity for electric coaches — the same MDPI review found electric bus factors ranging from about 16 to 72 g/pkm depending entirely on how clean the local electricity grid is.
- Route profile — steady highway miles beat stop-heavy urban routes on efficiency.
Put that in context: Our World in Data’s travel-footprint comparisons consistently show coach and train travel landing well below solo car trips and short domestic flights per passenger-kilometer. A wedding party sharing one coach is typically doing much better than making multiple separate car trips to the same venue, even before considering environmental benefits.
How to Calculate the Carbon Footprint of a Specific Charter Trip
You don’t need a lab to get a usable number. There are two standard approaches, and which one you use depends on what data you have.
1. Distance-based method (fastest, works with limited data). Multiply the trip distance in kilometers by an emission factor in grams of CO2 per passenger-kilometer, then divide by the number of passengers. Say your group books a coach for a 100-kilometer trip from Portland to a Willamette Valley wine event, using the review’s midpoint coach factor of about 35 g/pkm, carrying 45 passengers. You’d calculate: 100 km × 35 g/pkm = 3,500 grams, then divide by 45 riders. That works out to roughly 78 grams of CO2 per passenger for the whole trip, a fraction of what the same 45 people would generate driving separately.
2. Fuel-based (Tier 1) method (most accurate, needs operator data). If the operator can report actual liters of diesel or gasoline burned, multiply fuel consumed by a standard fuel emission factor. This is the approach KlimaLink’s bus calculation standard recommends when real consumption data exists, because it reflects the specific vehicle and trip rather than an industry average.
Pro Tip: Ask your operator directly whether they track fuel consumption per trip. If they do, insist on the fuel-based number for your reporting. It’s always more defensible than an estimated factor.
For sourcing your emission factor, lean on established references rather than guessing. Thrust Carbon’s coach emissions guidance and the MDPI review both provide vetted ranges, and calculators like the Bloci Carbon bus and coach tool let you plug in distance and passenger count for a quick estimate. One caution: electric coach factors swing wildly by region because they depend on local grid mix, so don’t apply a generic “EV = zero emissions” assumption without checking the source grid.
Cutting Charter Bus Emissions: What Planners Can Actually Control
Here’s the uncomfortable truth: swapping to a fancier vehicle rarely moves the needle as much as filling the seats you already booked. The MDPI review’s own analysis points to occupancy as the single biggest lever in per-passenger emissions, ahead of fuel type or vehicle age. That’s good news for planners, because occupancy is something you control at the booking stage, not something you have to wait for a manufacturer to fix.
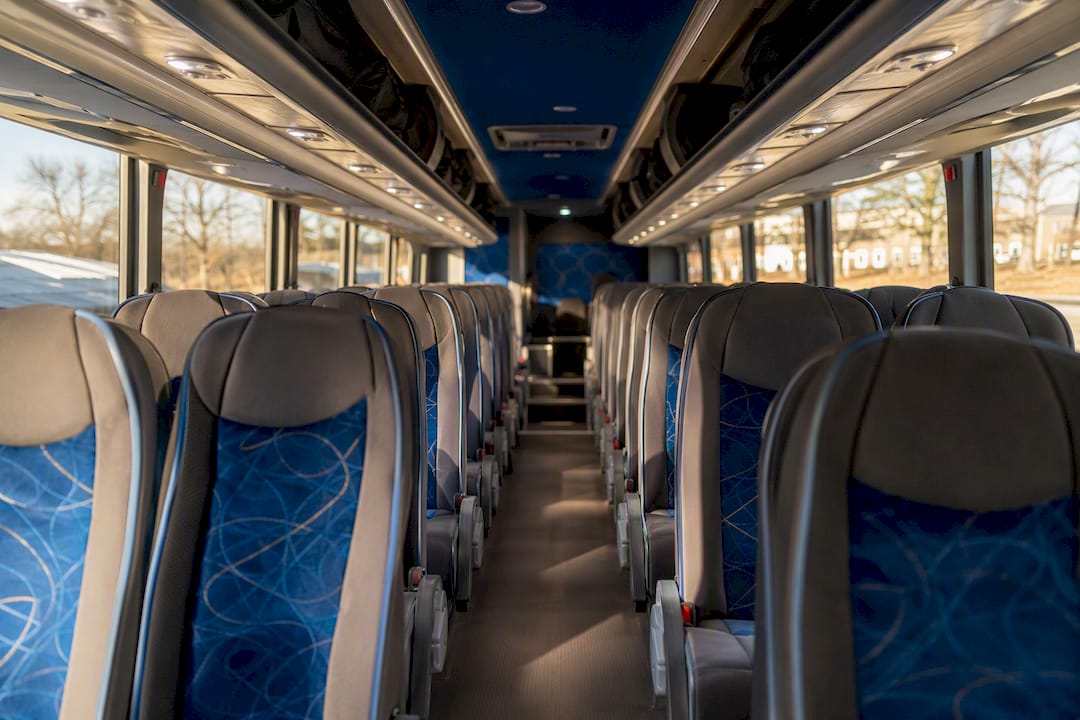
Start with vehicle sizing. A 56-passenger coach running at 20 seats filled produces a much worse per-person number than a 30-passenger minibus running full. Match the vehicle to your actual headcount instead of defaulting to the biggest bus available.
From there, a short checklist covers most of what’s within your control:
- Set a minimum occupancy target before you finalize the booking, and combine smaller groups onto shared vehicles where schedules allow.
- Plan routes to eliminate deadhead miles — the empty miles a coach drives before pickup and after drop-off count toward the trip’s footprint even though no passengers are aboard.
- Cut idling time at pickup and venue stops; extended idling burns fuel with zero distance covered.
- Ask about fuel alternatives like HVO renewable diesel or hybrid coaches, understanding that the lifecycle benefit varies by supply chain and, for electric options, by grid.
- Collect real activity data — passenger counts, actual mileage, fuel used if available — rather than estimating after the fact.
That last point matters more than it sounds. A practitioner-level habit worth adopting: prioritize operational fixes (right vehicle, right route, right occupancy) before you even consider offsets. Offsets are a backstop, not a first move, and they can’t compensate for a half-empty 56-seat coach making three separate trips when one full trip would have done the job.
Pro Tip: When you request quotes, ask the operator directly for a vehicle utilization plan and a deadhead-reduction commitment. Operators who can answer specifically, not vaguely, are usually the ones already tracking this data for their own fleet efficiency.
Reporting Coach Travel in Corporate ESG and Scope 3 Inventories
Coach travel belongs in Scope 3 Category 6 (business travel) of most corporate greenhouse gas inventories, and it’s worth including deliberately rather than leaving it out because it seems minor. Since coach travel is genuinely low-carbon relative to solo car trips, Thrust Carbon’s guidance notes that adding accurate coach data to a travel inventory tends to improve reported performance rather than hurt it, so there’s little reason to skip it.
A workable data-capture workflow for sustainability teams:
- At booking, log the route, distance, and vehicle type assigned.
- At trip completion, record actual passenger count and, if the operator provides it, fuel consumed.
- Apply the appropriate emission factor — fuel-based if consumption data exists, distance-based per KlimaLink’s tiered approach otherwise, and document which method you used.
- Log the result in your travel emissions inventory alongside flights and rail for a complete Category 6 picture.
On materiality: coach trips for a single event rarely move the needle alone, but recurring institutional travel, think school districts, conference organizers, or companies running regular shuttle programs, adds up fast enough to warrant consistent tracking rather than one-off estimates.
Reliant Transportation’s Take on Lowering Trip Footprints
Over a decade of running charter service across the Portland metro, the Willamette Valley wine region, and Hood River, one pattern holds up every time: the biggest emissions win happens at the booking desk, not on the road. Matching a well-maintained coach to the actual group size, rather than defaulting to whatever’s available, keeps occupancy high and per-passenger output low.
Reliant Transportation’s fleet upkeep and route planning experience exist precisely to support that fit. Clients who want cleaner reporting numbers can request passenger counts, mileage reports, and fuel-type disclosures directly. Ask for them. An operator who tracks this data confidently is one who’s already thinking about efficiency, not just availability.
— Dusty
Book a Lower-Carbon Group Trip With Reliant Transportation
Reliant Transportation is the practical alternative to piecing together a fleet of rideshares or solo cars for your Portland-area, Willamette Valley wine country, or Hood River event: one well-matched coach, full seats, and real trip data instead of a dozen scattered receipts and no emissions picture at all.

Fleet-matching is the core of how Reliant keeps per-passenger emissions down. Rather than defaulting to the biggest bus in the yard, the team sizes the vehicle to your headcount, plans routes to cut deadhead miles, and keeps the fleet maintained for fuel efficiency. Before you book with any operator, ask three questions: what occupancy do they expect for your group size, what’s their policy on deadhead and idling, and can they hand you passenger and mileage data for your own reporting. If you’re planning a wedding shuttle or a group trip through the Oregon wine country, reach out through Reliant Transportation to get a quote built around your actual group size, not a generic package.
Sources
- Carbon intensity of passenger transport modes: a review of emission factors, their variability and the main drivers
- How to calculate coach travel emissions – Thrust Carbon
- Travel and transport carbon footprint – Our World in Data
- KlimaLink bus calculation standard (Bus Calculation Standard)
- Bus and Coach Calculator – Bloci Carbon


Pingback: Portland Planners: Book Reliant for Airport Group Pickups
Pingback: Portland Planners: Verify $5M Liability for Corporate Retreat Transit
Pingback: Cut Cost and Carbon on Portland Event Transit: Shuttles vs Rideshares
Pingback: Avoid Bridge Delays on Portland Summer Wedding Transportation